Monitoring failed events in the Console
Snowplow pipelines separate events that are problematic in order to keep data quality high in downstream systems. For more information on understanding failed events see here.
For Snowplow customers that would like to benefit from seeing aggregates of failed events by type, there is an optional feature in the Snowplow BDP Console.

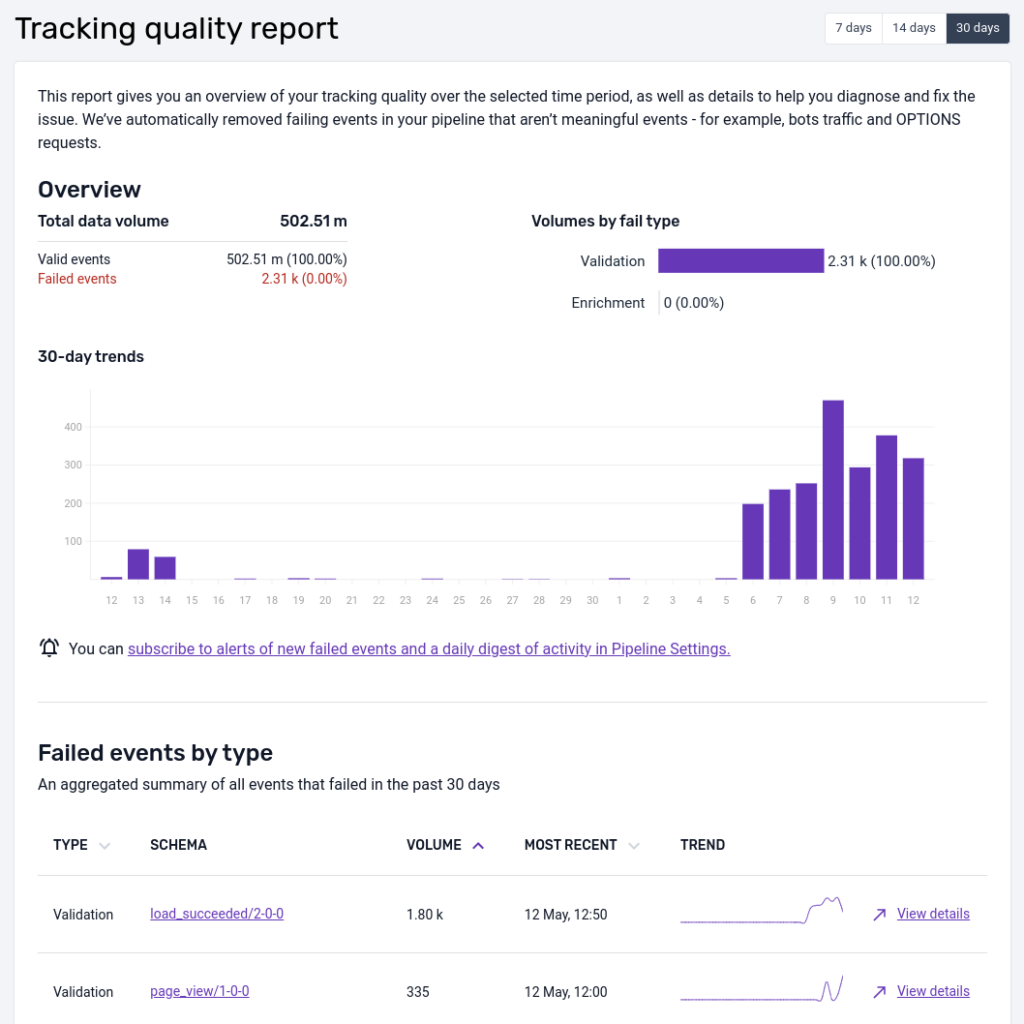
Example view of the failed events screen in the Snowplow BDP Console.
This interface is intended to give our customers a quick representation of the volume of event failures so that action can be taken. The UI focuses on schema violation and enrichment errors at present.
We've filtered on these two types of errors to reduce noise like bot traffic that causes adapter failures for instance. All failed events can be found in your S3 or GCS storage targets partitioned by type and then date/time.
At the top (currently for AWS customers only) there is a data quality score that compares the volume of failed events to the volume that were successfully loaded into a data warehouse.
The bar chart shows how the total number of failed events varies over time, colour-coding validation and enrichment errors. The time window is 7 days be default but can be extended to 14 or 30 days.
In the table failed events are aggregated by the unique type of failure (validation, enrichment) and the offending schema.
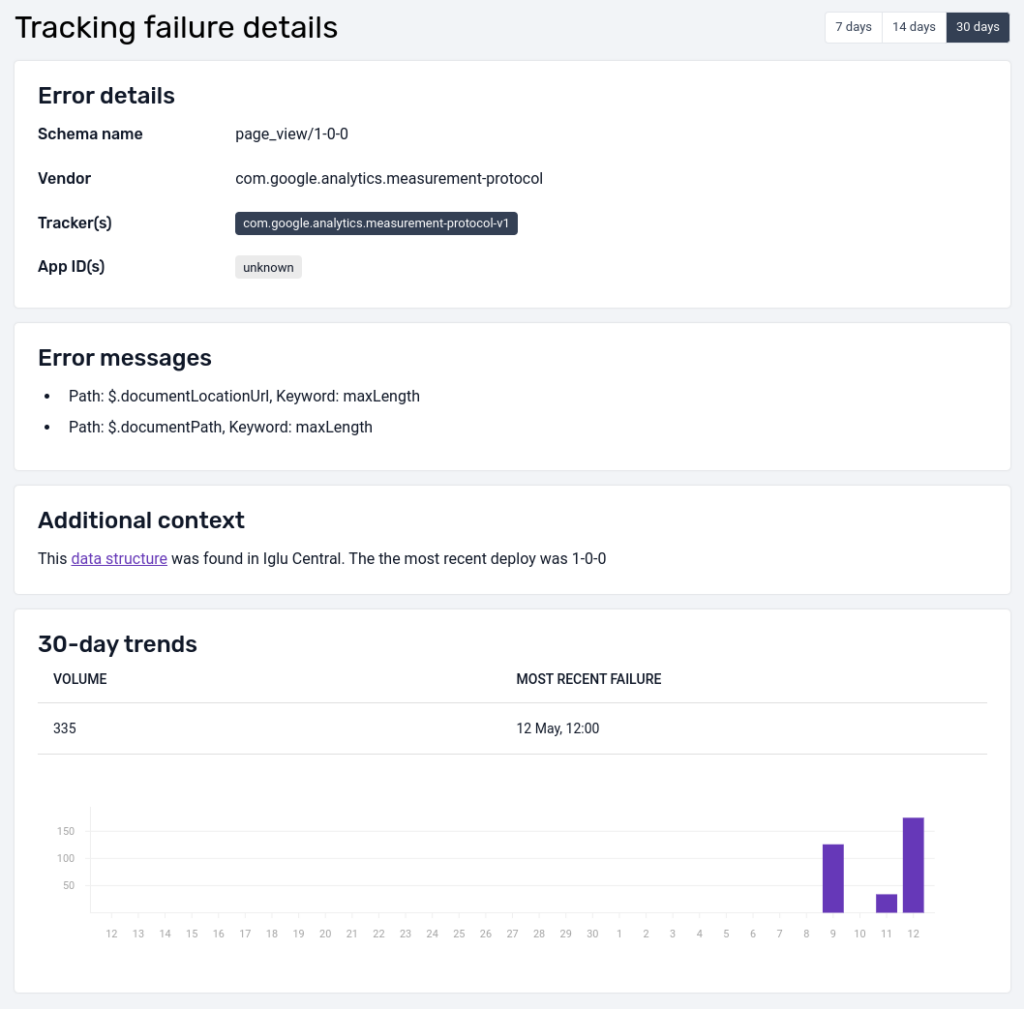
By selecting a particular error you are able to get more detail:

Example failed event detail view.
The detailed view shows the error message as well as other useful meta data (when available) like app_id as an example to help quickly diagnose the source and root cause of the error, as well as a bar chart indicating how the volume of failures varies over time for this particular failed event.
Additional infrastructure cost
To populate this screen, there is an additional micro-service running on your infrastructure to aggregate failures as they occur in your pipeline.
This is currently estimated to start at $160/month for AWS; $125/month for GCP. Costs may vary due to volume of failed events and spikes.
Therefore this is an optional addition for the console.